
The “State of the Great Lakes” report is out. What are the conditions of the Great Lakes? Are they getting better or worse?
Environmental disasters get a lot of attention when they occur in the Great Lakes basin, or anywhere for that matter. Many people saw or heard the news in July 2010 when a pipeline rupture released 24,000 barrels of crude oil into a tributary of the Kalamazoo River or in August 2014 when 400,000 people in the Toledo, Ohio, area were told not to drink the water after cyanotoxins spiked in Lake Erie. Yet the day-to-day conditions of the Great Lakes receive far less attention.
For instance, a State of the Lakes highlights report was released in June 2020 by the governments of Canada and the United States. The highlights report presents key findings from the State of the Great Lakes technical report released by the two governments in February 2021. Though the reports are based on the work of more than 200 government and non-government Great Lakes scientists, they get relatively little public attention.

Why are the Great Lakes important?
The Great Lakes contain one fifth of the world’s fresh surface water and are one of the most ecologically diverse ecosystems on Earth. They provide a source of drinking water to tens of millions of Canadians and Americans. The Great Lakes are important to the economies of both countries, supporting manufacturing, farming, transportation, tourism, recreation, energy production and other forms of economic growth. The health of the Great Lakes is also culturally significant to the many Indigenous peoples in the region.
For years, to accommodate the byproducts of economic growth, some tributaries to the Great Lakes were used for disposal of waste and byproducts of economic growth and aging infrastructure. Solid wastes were frequently dumped into marshlands, industrial wastes were either buried or dumped into nearshore waters and wetlands, and liquid wastes were dumped directly into streams and the lakes.
The Great Lakes Water Quality Agreement
To address environmental problems in the Great Lakes, the governments of Canada and the United States signed the Great Lakes Water Quality Agreement in 1972. Through the Agreement, the governments work cooperatively with tribal nations, First Nations, the Métis Nation, provincial, state and municipal governments, watershed management agencies, other local public agencies, industry and the public to restore and protect the water quality and aquatic ecosystem health of the Great Lakes. The Agreement has been revised several times, most recently in 2012.
In the 1987 version of the Agreement, the two countries committed to assess the progress made toward achieving the objectives of the Agreement.
Answering questions about conditions and improvements in the lakes with any level of credibility is not a simple task. First of all, scientists and environmental resource managers need to decide what matters, what to measure and how to do the measuring. Indicators describe and measure the condition of the environment in the same manner as indicators describe human health (e.g., blood pressure) and economic status (e.g., Dow Jones Index). While the indicators must be scientifically based, take-home messages about conditions and trends must also be understandable.
But how do you decide what matters most and what should get measured and become an indicator? The Great Lakes Water Quality Agreement establishes nine general objectives that cover the condition of drinking water, beaches, edible fish, levels of toxic chemicals, levels of nutrients, invasive species, habitat and species, groundwater and other substances, materials or conditions (such as climate change) that may impact the biological, chemical or physical integrity of the lakes.
Canada and the U.S. develop the State of the Lakes report, led by Environment and Climate Change Canada and the US Environmental Protection Agency. The IJC is responsible for providing its own independent binational assessment of progress. In its 2013 Report on Great Lakes Water Quality (web pages 13-16), the IJC discussed the relationship of its assessment with state of the lakes reporting and recommended that the State of the Lakes report use a smaller set of indicators that clearly link to the objectives of the Agreement.
In their 2017 State of the Great Lakes report, the governments adopted IJC’s recommendation and used nine indicators to report on the ecosystem with each of the nine indicators linked to one of the nine objectives in the Agreement. Each of the indicators were assessed as Poor, Fair or Good based on 44 more refined measures called sub-indicators. Also, trends of Improving, Unchanging or Deteriorating were identified for each sub-indicator and indicator. This approach continued in the technical report released in 2021, when an additional sub-indicator was added for a total of 45.
Timeframe for Decisions
So, are the lakes getting better or worse? To answer that question, you have to decide on what timeframe to examine.
Depending on the topic, the trend analysis could be over five years, a decade, a generation or longer. For instance, the IJC’s 2013 Assessment of Progress report compared conditions between 1987 and 2012, the 25-year-period between revisions of the Great Lakes Water Quality Agreement.
The IJC’s 2017 First Triennial Assessment of Progress report (page 59) included a chapter that discussed the State of the Great Lakes report and informed the public about status and trends. In the technical appendix (page 39) and informal communications with the governments, the IJC identified the need for future State of the Great Lakes reports to describe changes over various points in time.
The governments adopted this recommendation. In the most recent round of State of the Great Lakes report, the governments picked a 10-year time frame to answer the question about the lakes getting better or worse. This is valuable, because when considering if the lakes are getting better or worse, the report now answers the question of “compared to when?”
Summary of Status and Trends
So finally, considering what is entailed in answering the questions, here are the answers as presented in the most recent State of the Great Lakes highlights report:

Fair and Unchanging
To characterize everything in two words, the overall condition is fair and the overall trend is unchanging. This table provides quick and seemingly simple answers to big questions, yet there are a lot of details beneath these assessments.
For instance, drinking water and beaches are in good condition, while the situation with invasive species is poor and getting worse. Terrestrial invasive plant species continue to impair habitat, biodiversity and water quality, and various species of invasive mussels continue to negatively impact the quality and productivity of lake ecosystems.
There is some good news, however. Due to successful efforts to control sea lamprey, lake trout populations have begun to recover over the last 10 years.
Getting Technical
The State of the Great Lakes technical report is valuable because scientists and resource managers need more details to make informed decisions.
The report illustrates the interrelationships that occur in the ecosystem and between sub-indicators. One example is the sub-indicator “condition of beaches” which is impacted by several other sub-indicators including water levels, precipitation, harmful algal blooms, and zebra and quagga mussels.
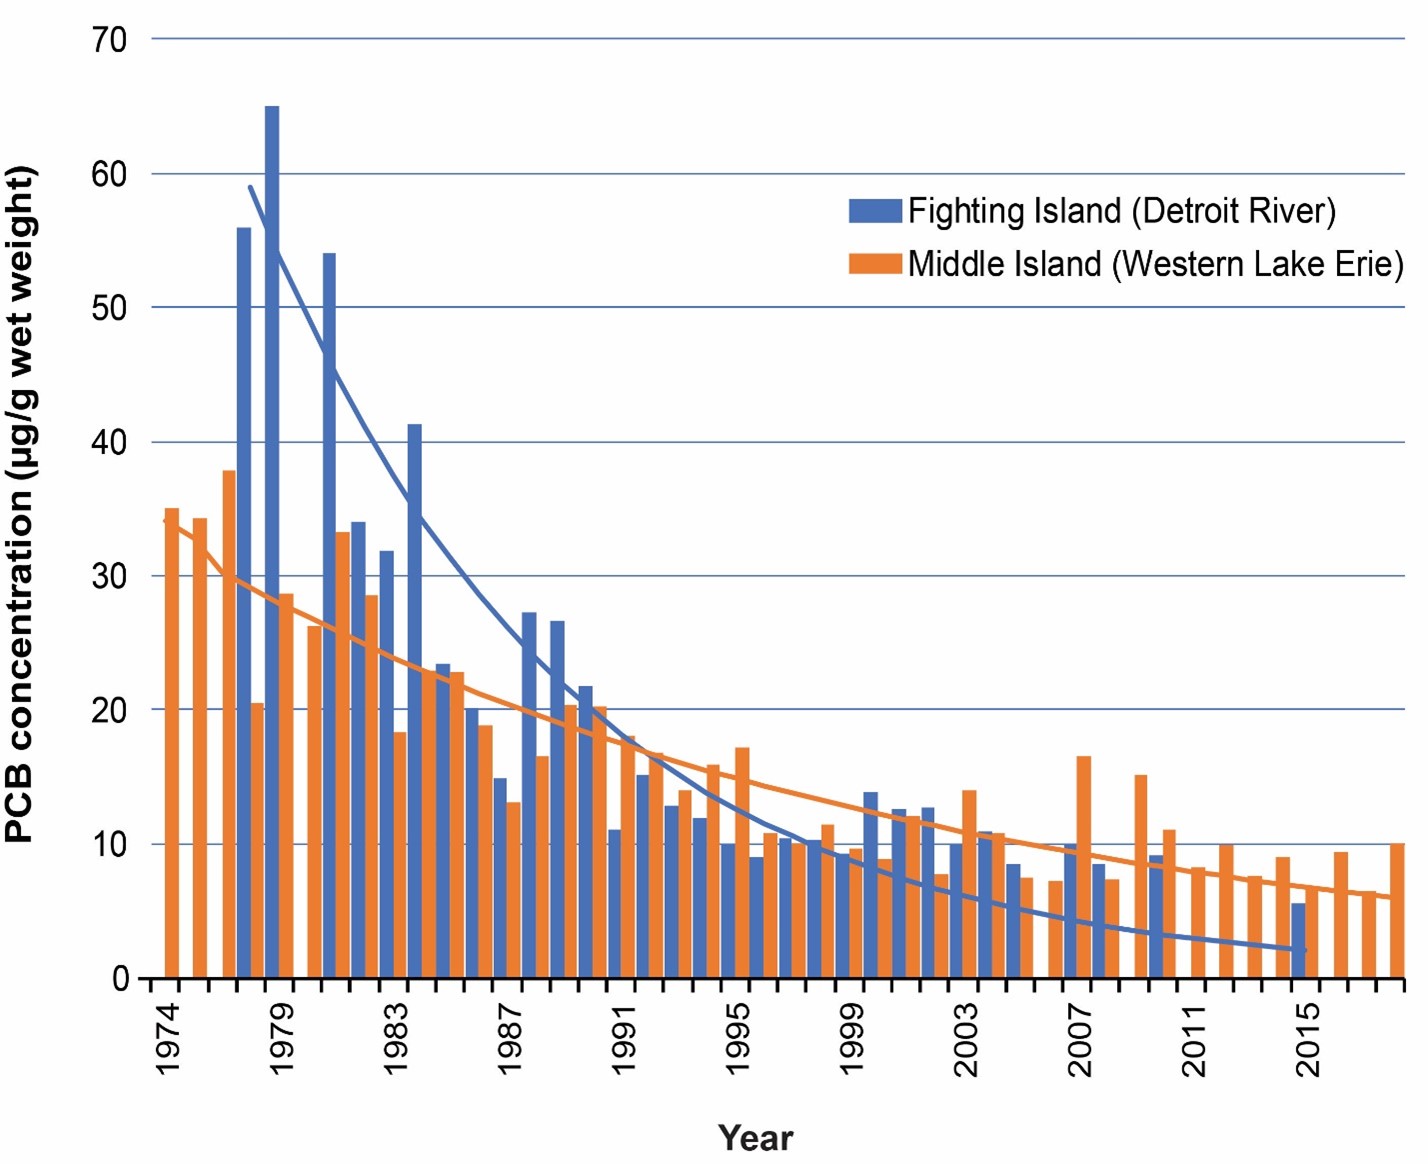
The large State of the Great Lakes technical report, at 688 pages, was not written for a public audience, but provides the science to support the assessments and key messages. Let’s consider toxic chemicals, which has five sub-indicators, one of which is toxic chemicals in herring gull eggs.
As shown by the graph, the concentrations of one such chemical in the birds’ eggs (polychlorinated biphenyls or PCBs) have gone down considerably in the past 40 years and have continued to decrease over the past 10 years. This is a positive finding which continues to trend in the right direction. However, there is variation among lakes for this sub-indicator and the others summarized in the status table, so the overall status of the indicator toxic chemicals across the Great Lakes is therefore rated as fair, with the trend varying between unchanging and improving.
Variations in, and Perceptions of, Trends
The State of the Great Lakes report amasses thousands of data points to summarize the status and trends of each lake and the system overall, but there is immense variation within those trends. So, when we experience the lakes for ourselves, we only get to perceive a few of those data points at a time; we may be observing something consistent with the reported trend, or we may be seeing something outside of the trend.
This disparity is consistent with the IJC Great Lakes Water Quality Board’s 2018 Great Lakes Poll findings. The poll surveyed residents’ opinions about Great Lakes issues, including perceptions about the condition and trend of the Great Lakes. The 2017 State of the Great Lakes report asserted the lakes were fair and unchanging overall, but 33 percent of poll respondents felt conditions were deteriorating, 29 percent said conditions were unchanging, 16 percent said conditions were improving, and 22 percent did not know. When a Great Lakes resident observes the lakes, they may be observing the trend, or they may be observing that variation.
Therefore, developing an awareness, and appreciation, of the State of the Great Lakes report can illuminate differences between variation-rich trends and our own experiences with the lakes.

Victor Serveiss is environmental adviser in the IJC’s US Section office in Washington D.C.